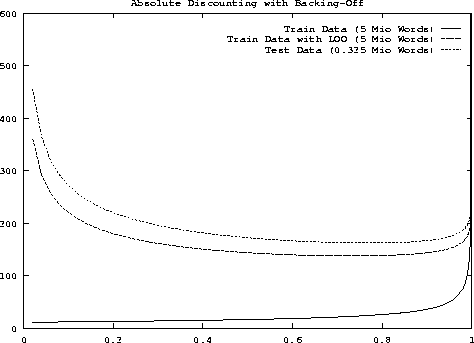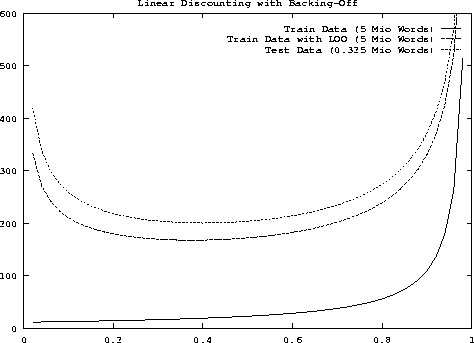
Figure 7.3: Perplexity as a function of b for absolute discounting with backing-off
To illustrate some of the issues in language modelling, we discuss some experimental results [Rosenfeld (1994), Generet et al. (1995)]. The results were obtained for a subset of the Wall Street Journal (WSJ) corpus. The vocabulary consisted of the (approximately) 20000 most frequent words. In addition, there were two non-speech words. First, each out-of-vocabulary word was replaced by a symbol for unknown word. Second, to mark the sentence end, a symbol for sentence boundary was added. There were three different training sets with 1, 5 and 39 million words and a separate test set of 0.325 million words as shown in Table 7.2.
Table 7.3 summarises some numbers from which we can estimate the coverage for the three training sets . This table gives the number of different bigrams and the number of singleton bigrams in training . The same numbers are also given for trigrams. As mentioned in the context of linear discounting , we can use these numbers to estimate the probability for new unseen trigrams. We obtain a probability of 0.57, 0.44 and 0.28 for the training sets of 1, 5 and 39 million words, respectively.
| Size of training corpus | 1 Mio | 5 Mio | 39 Mio |
| A) absolute discounting and interpolation [Generet et al. (1995)] | |||
| bigram model (with singletons) | 288 | 217 | 168 |
| trigram model | 250 | 167 | 105 |
| + singleton | 222 | 150 | 97 |
| + unigram cache | 191 | 133 | 90 |
| + bi-/unigram cache | 181 | 128 | 87 |
| + singleton + bi-/unigram cache | 173 | 124 | 85 |
| B) Katz' backing-off [Rosenfeld (1994)] | |||
| trigram model | 269 | 173 | 105 |
| + bi-/unigram cache | 193 | 133 | 88 |
| + bi-/unigram cache + maximum entropy | 163 | 108 | 71 |
The perplexities for different conditions are summarised in Table 7.4. Table 7.4 consists of two parts, namely A) and B), for which the results are reported in [Generet et al. (1995)] and [Rosenfeld (1994)], respectively. In either part, for each language model test, there are three perplexities, namely for the three training sets of 1, 5 and 39 million words, so that the influence of the size of the training set on the perplexity can be seen immediately. Unfortunately, a direct comparison of the perplexities reported for the two parts of Table 7.4 is difficult for two reasons. First, due to small differences in selecting the articles from the Wall Street Journal corpus , the corpora used in the two parts of Table 7.4 are not completely identical. Second, the unknown word may be handled differently in the perplexity calculations.
For part A) of Table 7.4, the methods have been described in this chapter. The baseline method was absolute discounting with interpolation ; the discounting parameters were history independent. The baseline trigram model was combined with extensions like the singleton backing-off distribution, and the cache model, which was tested in two variants, namely at the unigram level and at the combined unigram /bigram level. For comparison purposes, the baseline trigram language model was also compared with a bigram language model.
Considering part A) of Table 7.4, we can see:
For the CMU results obtained by [Rosenfeld (1994)], the trigram model was based on Katz' backing-off [Katz (1987)], which uses the Turing-Good formula [Good (1953)]. To reduce the memory requirements, the trigram singletons in the training data were omitted. The trigram model was combined with the two cache variants (unigram cache and bigram cache) and the maximum entropy model by linear interpolation .
When looking at the perplexities in part B) of Table 7.4, we see that they are better than those shown in part A) only in the case that the maximum entropy model is added. The maximum entropy model has two characteristic aspects [Rosenfeld (1994)]:
In comparison with the conventional trigram language model, the maximum entropy requires a much higher cost in terms of programming and CPU time for training . There is an improvement in the order of 20%. This observation is in agreement with the general experimental experience with other language model techniques: To achieve an improvement over a baseline model like the trigram model in combination with the cache, a lot of effort is required, and even then the improvement may be small. For more details on word triggers and maximum entropy, see [Bahl et al. (1984)], [Rosenfeld (1994)], [Lau et al. (1993)], respectively.
To study the dependence of perplexity on the discounting parameters, experimental tests were carried out by [Generet et al. (1995)]. Figure 7.3 and Figure 7.4 show the perplexity as a function of the discounting parameters.

Figure 7.3: Perplexity as a function of b for absolute discounting
with backing-off

Figure 7.4: Perplexity as a function of ![]() for linear discounting with backing-off
for linear discounting with backing-off
In all cases, the training was based on the 5-million corpus. For both figures, there were three conditions under which the perplexity was measured:
In other words, the last two conditions correspond to the cross-validation concept: either we create a test set from the training data by leaving-one-out or we are given a completely separate set of test data .
When comparing the two types of smoothing, we can see that the perplexity curve for absolute discounting has a very flat minimum for the two cross-validation conditions. This shows that the choice of the parameter b for absolute discounting is not critical. The perplexity curve for linear discounting shows a different behaviour in that the minimum is more distinct. The optimal perplexity for linear discounting is significantly higher than the optimal perplexity for absolute discounting. However, we have to remember that the linear discounting model here is based on history independent discounting parameters, and it is a well known fact that history dependence is important in the case of linear discounting [Jelinek & Mercer (1980)].