Friedrich-Schiller-Universität Jena
Fakultät für Mathematik und Informatik
Institut für Angewandte Mathematik
Frequency Distributions of Points of No-Three-in-Line Configurations
The following table gives you a feeling of the frequency distribution for the selected points of
large no-three-in-line configurations. Here you see the upper left quarter of the grid of all
solutions for n=20 in symmetry class rot4. In each of the 20x20 locations of the quarter
the points of the 2x541 different configurations are summed up and these values are
decreased by the expected number of these points (54.1) for each location.
 -54 -54 -45 -40 -42 -38 -20 -29 -31   4  -6   1  32 -41  45  23  65  65  99  68

 -54 -54 -48 -44 -44 -41 -29 -34 -19 -17  22  23  27  49  57  31  37  23  38  79

 -45 -48 -34 -39 -31 -25 -16 -16   4  -1   9  20  60  42  14  32   8  35  19  14

 -40 -44 -39 -40 -26 -14  20  23  10  32  34  17  10   6 -34  28   7  -3  25  30

 -42 -44 -31 -26 -40  -2  33  12  17   7  29   6  23  20  29  25   3 -13 -10   6

 -38 -41 -25 -14  -2 -30  32  23  21  19  18  16   2  -7   9  14  -3 -10  -7  25

 -20 -29 -16  20  33  32 -34  23   2  32  12  11  23  -7  -7 -31  -7 -24   4 -15

 -29 -34 -16  23  12  23  23  -8  26  26 -13 -16  -4   0   6  13  -6 -21   2  -5

 -31 -19   4  10  17  21   2  26 -34  11  -5   4  -2  13 -19   2  -6   9   9 -10

   4 -17  -1  32   7  19  32  26  11 -30  -5  -5 -23   4  -2 -24 -21   7  -1 -11

  -6  22   9  34  29  18  12 -13  -5  -5 -40   1 -16  10  -8  -7  11  -7 -21 -16

   1  23  20  17   6  16  11 -16   4  -5   1 -50   1   9  -7   7 -11   1 -16 -10

  32  27  60  10  23   2  23  -4  -2 -23 -16   1 -14   0 -17 -28 -15 -19 -28 -10

 -41  49  42   6  20  -7  -7   0  13   4  10   9   0 -48  -9   2  -5 -16  -6 -14

  45  57  14 -34  29   9  -7   6 -19  -2  -8  -7 -17  -9 -30  -6   1   3  -8 -15

  23  31  32  28  25  14 -31  13   2 -24  -7   7 -28   2  -6 -22  -8 -16 -16 -17

  65  37   8   7   3  -3  -7  -6  -6 -21  11 -11 -15  -5   1  -8  -8 -15 -24  -1

  65  23  35  -3 -13 -10 -24 -21   9   7  -7   1 -19 -16   3 -16 -15  56 -18 -35

  99  38  19  25 -10  -7   4   2   9  -1 -21 -16 -28  -6  -8 -16 -24 -18   2 -41

  68  79  14  30   6  25 -15  -5 -10 -11 -16 -10 -10 -14 -15 -17  -1 -35 -41 -20
So negative values, like in the corner, indicate frequencies lower than the average and
positive values, like in the middle of the sides, are higher than the average of 54.1 .
This picture 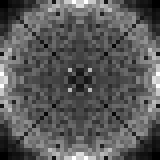 shows the whole grid
where these data are maped into grayscale values with high frequencies/densities are bright
and low densities are dark represented. The rotational symmetry around the center is evident. So the frequency/density distribution
is roughly a function of the euclidean distance to the grid center. Here are
the according pictures for n=38
shows the whole grid
where these data are maped into grayscale values with high frequencies/densities are bright
and low densities are dark represented. The rotational symmetry around the center is evident. So the frequency/density distribution
is roughly a function of the euclidean distance to the grid center. Here are
the according pictures for n=38 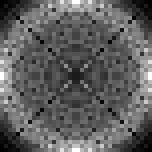 and n=36
 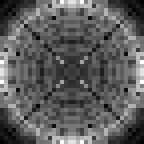 .
.
And
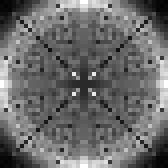 shows for n=42 the frequencies calculated of those 746 configurations.
Everything above was done and known until 1997-01-02.
Since 2026 Thomas Prellberg, Queen Mary University of London, UK, has achieved much progress in discovering previously unknown no-three-in-line solutions/configurations and pushed the limits for grid sizes
e.g. in symmetry class rot4 further. So he could generate for all 10441 configurations in symmetry class rot4 of the 56 x 56 grid this
 corresponding frequency map aka. "heatmap" in April 2026. And finally for n=57
in symmetry class rct4 he constructed this
corresponding frequency map aka. "heatmap" in April 2026. And finally for n=57
in symmetry class rct4 he constructed this
 2 dimensional frequency distribution from all 833 configurations on 31th May 2026.
+
Achim Flammenkamp
2026-06-12