Automatic directory listing: ShanghaiSummerSchool2018
For those who are interested in computational phonetics, I have written relatively simple Python code which uses the same techniques as I used in my presentations. The F0 estimation in my presentations uses an external program called "get_f0", based on the algorithm RAPT by David Talkin, and is not included in this example. If you also have speech processing code in Python, please share.
The code n the ZIP file generates a waveform and spectrogram for speech files in WAV format. The ZIP file contains the following two files:
- Python code: waveandspectrum.py
- Test WAV file: test.wav
WaveAndSpectrum.zip
The code presupposes that you have Python 2.7 installed, and that you know how to use Python. The code has not been tested with Python 3. Further instructions can be found as a comment string at the beginning of the code file.
This is the image which should be generated by the code using the test WAV file:
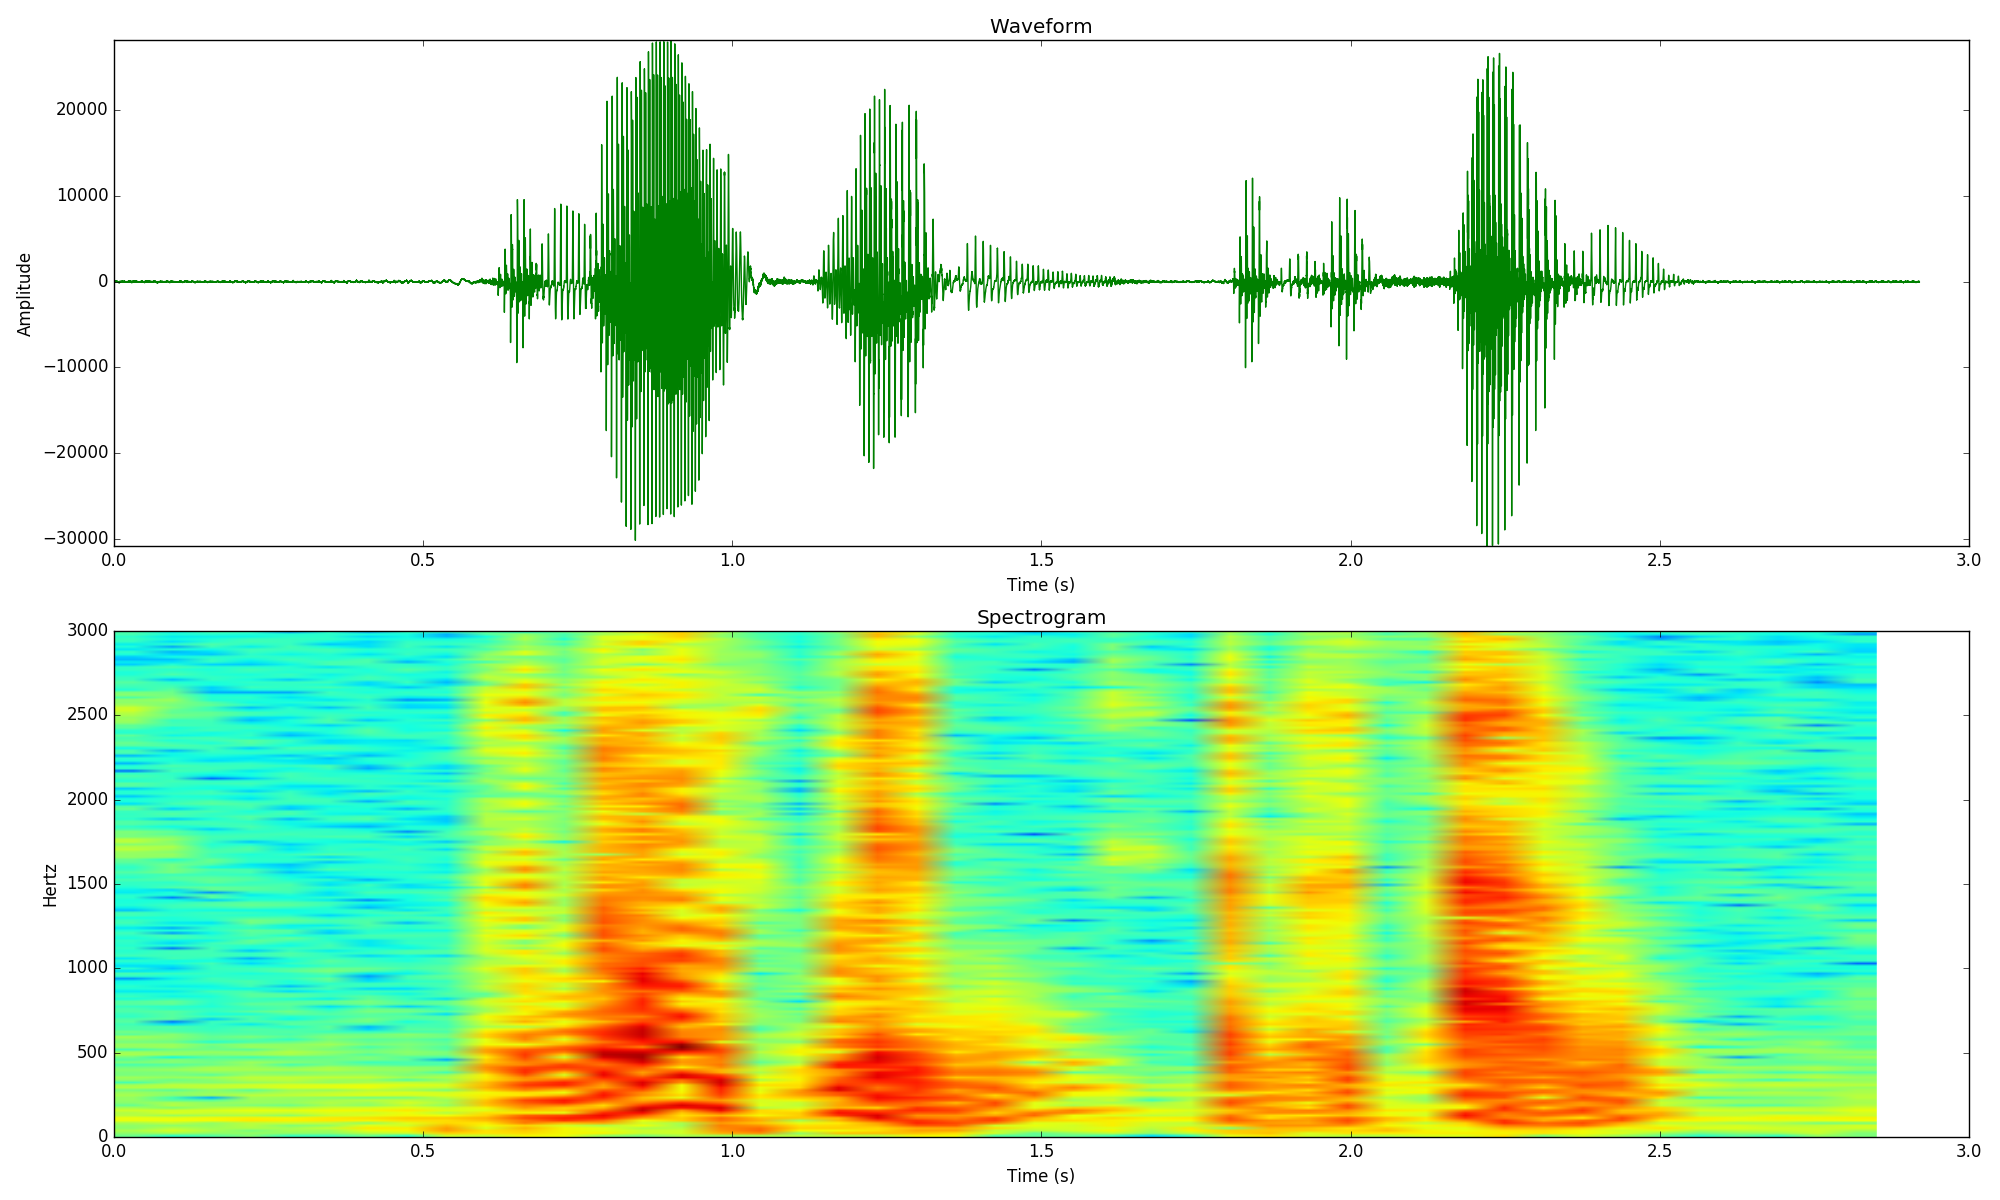
For your convenience, the code is reproduced here:
#!/usr/bin/python
# sigproc.py
# D. Gibbon 2018-05-
"""
Note:
This program is incomplete, in the sense that it does not scale all possible data durations into account, and does not handle all possible errors of input or logic.
Input: speech file in WAV format
Output: plots of waveform and spectrum
Parameters: default parameter values are defined in the code. The parameter values could alternatively be input as command line arguments, or put into a separate file.
Command line for test input:
python waveandspectrum.py test.wav
"""
#================================================================
# Import library modules
import sys
import numpy as np
import matplotlib.pyplot as plt
import scipy.io.wavfile as wave
from scipy.signal import spectrogram
#================================================================
# Check command line arguments
args = sys.argv
if len(args) < 2:
print "Usage: spectrum.py wavfilename"
exit()
wavfilename = args[1]
#================================================================
# Read and check WAV file
try:
samprate,signal = wave.read(wavfilename)
signal = np.array(map(float,signal))
except:
print "Error:", wavfilename,"has wrong format or does not exist."
exit()
##### Check for mono or stereo file
channels = signal.shape
if len(channels) > 1:
print "Too many channels. Use a mono recording."
exit()
print signal.shape
#================================================================
# Draw figure
figwidth = 20 ; figheight = 12
figrows = 2 ; figcols = 1
plt.figure(1,figsize=(figwidth,figheight))
# Waveform
rownum = 0 ; colnum = 0
ax1 = plt.subplot2grid((figrows,figcols), (rownum,colnum),rowspan=1,colspan=1)
ax1.set_title("Waveform")
ax1.set_xlabel('Time (s)')
ax1.set_ylabel('Amplitude')
x = range(len(signal))
y = np.array(signal)
ylen = len(y)
ysecs = int(round(0.5+float(ylen) / samprate))
ylen = ysecs*samprate
ax1.set_xlim(0,ylen)
ax1.set_ylim(min(signal),max(signal))
if ysecs<10:
tickscale = ysecs*2.0
else:
tickscale = ysecs/5.0
xticks = range(0,ylen+1,int(ylen/tickscale))
xticklabels = [ "%.1f"%(float(l)/samprate) for l in xticks ]
ax1.set_xticks(xticks)
ax1.set_xticklabels(xticklabels)
plt.plot(x,y,color='green')
# Spectrogram
rownum = 1 ; colnum = 0
ax2 = plt.subplot2grid((figrows,figcols), (rownum,colnum),rowspan=1,colspan=1)
ax2.set_title("Spectrogram")
ax2.set_xlabel('Time (s)')
ax2.set_ylabel('Hertz')
# Set spectrogram minimum and maximum display frequencies
specmin = 0 ; specmax = 3000
# Set the number of samples for each spectral slice
# Adjust the number for narrow-band or broad-band spectrogram
spectrogramwindow = int(samprate/15.0)
NFFT = spectrogramwindow
ax2.specgram(signal, NFFT=NFFT, Fs=samprate)
plt.axis(ymin=specmin, ymax=specmax)
plt.tight_layout()
plt.show()
#================================================================
# End of file
D. Gibbon, Monday, 18 July 2018 14:26:09 Uhr CEST