DistGraph: Visualisation of Distances in Virtual Spaces
D. Gibbon, U Bielefeld
This is a test prototype. It includes extensive error trapping (with notifications in red), but if you see a weird 'Traceback' message this means that there is an untrapped error in the dataflow. If this happens, please send me an email with details of the data and settings which triggered it. Thanks!
Top
-
Description
-
Functional specs
-
Design specs
-
Assignments
Citation: publication, online tool
- Gibbon, Dafydd. 2014. Visualisation of distances in language quality spaces: DistGraph, an online teaching tool for language typology data mining. Bielefeld: U Bielefeld. URL: http://wwwhomes.uni-bielefeld.de/gibbon/DistGraph/
- Gibbon, Dafydd. 2016. Legacy language atlas data mining: mapping Kru languages. LREC 2016.
(Paper PDF,
poster PDF)
|
Demos based on language atlases of Côte d'Ivoire
Possible empirical error types in demo analyses:
- possible different criteria or errors in analyses of different languages,
- possible typographic errors in language atlases or in database,
- occurrence of non-ASCII characters in database.
|
Example: virtual maps of Kru languages
These virtual maps are based on differences between the consonant inventories of Kru languages of Côte d'Ivoire (see Kru demo link for further information).
The animation cycles through different numbers of the main pairwise distinguishing features/properties (consonants, not phonetic features), from distance 0 (0 differences) to the maximum distance 19 (19 differences).
The main point to note is the gradual emergence, first of the Eastern and Western Kru groups, and then the emergence of the entire Kru family.
More detailed phonetic feature criteria, or other criteria may lead to differences in details.
|
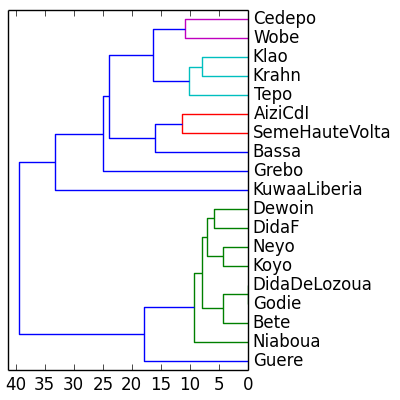
Example: similarity dendrogram for Kru consonant inventories
The languages are grouped into clusters on the basis of their similarity in terms of shared consonants. The clusters are grouped into larger clusters, also on the basis of consonants shared between clusters. The similarity relations expressed by the dendrogram correspond closely to previous linguistic classifications in some cases, but not in others, a result which is to be expected since only consonants were used, while earlier classifications are also based on lexical, grammatical comparison and on the comparison of phonological constraints.
|
Top
-
Description
-
Functional specs
-
Design specs
-
Assignments
Description
DistGraph is a parametrised online tool (select Interface
for data input and parameter settings) for displaying distances between entities and for discovering clusters of similar entities such as related languages, based on differences (= distances) between selected sets of properties / features. The tool is parametrised to be able to specify the maximum range of distances to be displayed. The larger the specified distance, the more distance relations are included. With smaller distances, the graph tends to split into subgraphs showing less related clusters of units.
The empirical reasons which determine these distances are complex. The entities may indeed differ exactly as calulated, but different methods may have been applied to analysing the entities, or there may simply be errors in the data. Therefore careful plausibility checks with reference to other analyses are required.
Top
-
Description
-
Functional specs
-
Design specs
-
Assignments
Functional specification: 'learning by doing'
The basic methodologial principle for training in language and speech resource creation for speech and text is 'learning by doing'. In this context, learning by doing means small student projects with specific tasks in which students learn to develop and process speech and text resources autonomously. Learning can also be in the area of software tool development: the software tools provided are models which be used for the creation of further tools by students with a computational background.
- A data table in CSV format (Character Separated Value, see the demo example in the data field below) is prepared from legacy data, textbook data or fieldwork results.
- Differenes between pairs of entities in the table are measured using the Levenshtein Edit Distance (LED) metric, which counts the minimum number of edit changes (i.e. insertions, deletions, substitutions) needed for converting one string/list to the other. If the sequences to be compared are of equal length, and only each position is to be compared, then the measure is the Hamming Distance. If the property names for a given object are all different, a Set Intersection Relative Distance (SIRD) metric (pairwise set union size minus set intersection size) can be used. The distance metricis first applied to the property lists of each pair of entities in the data table, and produces a distance table (like the table used in displaying distances between cities). The distance table is then represented as a set of triples, consisting of pairs of entities and their distance, from which a graph is drawn. The table and triple data structures are also available as output options.
- The triple data structure is interpreted as node pairs and connecting edges in a graph. Degrees of distance can be selected: the higher the distance index, the more connections will be selected for the graph.
|
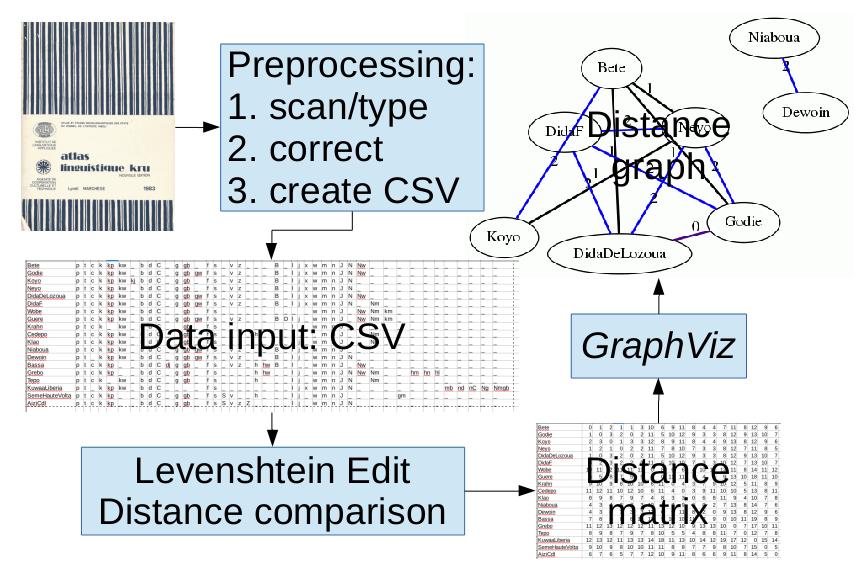
Distance graph generation workflow.
|
Top
-
Description
-
Functional specs
-
Design specs
-
Assignments
Design specification
The distances are not represented by edge length in the graphs (in general this would result in too many dimensions to render on a 2-dimensional screen), but are shown as edge labels and also colour coded. (Edge distance rendering can be approximated by dimensionality reduction, but software libraries for this are currently not available on this server.)
Outputs:
- For further processing with other applications:
- a Levenshtein edit distance matrix for object properties, over lists rather than strings, symmetrical around the top-left to bottom-right diagonal,
- a set of non-redundant Levenshtein edit distance triples from one side of the matrix diagonal (minus the diagonal).
- a parametrised graphical rendering of Levenshtein edit distance relations, edges labelled with distances and marked with colours, not drawn to scale (uses the GraphViz tool). The distance colour codes from 0...10 are 'indigo', 'black', 'blue', 'darkgreen', 'brown', 'red', 'orange', 'yellow', 'green', 'lightblue', 'pink'. Larger distances are coded in light grey.
Sample graph outputs for the GraphViz dot engine and maxdist settings 0...8.
Sample graph outputs for the GraphViz neato engine and maxdist settings 0...8.
Sample graph outputs for the GraphViz twopi engine and maxdist settings 0...8.
Sample graph outputs for the GraphViz circo engine and maxdist settings 0...8.
With some parameter settings, which I have not been able to catalogue, the circo engine from the GraphViz package fails with a core dump and does not generate a graph (not my fault ☺).
|
Browser compatibility: The graphs are rendered correctly by the Firefox, Chrome and Dolphin browsers. After a parameter setting change, some Microsoft browsers (e.g. in Windows 8, WindowsPhone 8) do not update parameters correctly and the output needs to be reloaded in order to do so.
Top
-
Description
-
Functional specs
-
Design specs
-
Assignments
Suggested assignments
- Start with the dot engine and compare the results for data ranges with maxdist 1, ..., 6. What determines the appearance of subgraphs? What do the s
ubgraphs tell you about the languages in different subgraphs?
- Compare the results for the dot and the neato graph engines. Which is more informative? Explain.
- Compare results for the other graph engines. Which do you prefer, and for what reason?
- Compare the consonant graphs with the graphs for nasal vowels and non-nasalvowels. Are the graphs for these different units comparable or different? Explain the differences.
- Take any other dataset - e.g. properties of different people, pets, towns,... and examine the graphs.
- Apply the methods used in these assignments to a language of your own choice.
Acknowledgements
The idea for this online tool occurred to me during a lecture by Gerhard Jäger, Tübingen, on modelling language distances in relation to geography and migration, and later in discussions on this theme with Stavros Skopeteas, Bielefeld, and Firmin Ahoua, ILA, Abidjan. Grateful acknowledgements to François Kipre Ble, ILA, Abidjan, for loaning a copy of the Kru language atlas used for the demo data, and to colleagues at ILA for donating the two-volume Kwa language atlas. Many thanks to Jue Yu for suggestions on improving the user interface, and to Jolanta Bachan for overall assessment.
 CGI implementation using GraphViz library.
D. Gibbon email
Updated Monday, July 7, 2014 12:04:35 PM CEST